
Your Portal may allow you to see enhanced analytics from your App usage.
Note that your colours will likely vary to those shown below based on your branding guidelines. Simply choose the option below that most closely resembles your portal.


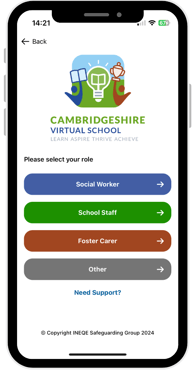
This most likely looks like your portal if you're an education customer, or your portal is housed at education.ineqe.com >>
Advanced Analytics
You have a number of Analytic capabilities built into your App, and all can be accessed on your Web Management Portal from the left hand side bar in the section titled Analytics. When clicked this will reveal a drop down of all possible analytics, with the dashboard giving you a scrollable overview. All of these options can be viewed by App Role, and narrowed down into a specified time frame.
 App Access by User Role
This indicates the kind of audience are accessing the app from your identified groups listed in the role selection. This analytic is based on which role is selected when users use the app, and if they switch between,
NOTE that if your App is not account based, this analytic is not 100% accurate on number of users, only the roles selected and the frequency with which they are selected.
Push Notification Engagement
This displayed as a bar graph and gives you data on for how long a given Push Notification was looked at - if it was glanced, read or skimmed over, and how many times it was opened.
Device Type
This indicates whether your users on average are using an Android or an iOS device when accessing the App.
Page Views, Engagement and Top 5
Here you will see the frequency of the views of each individual page within your App, how long pages where looked at and what your 5 top pages are for views within the App. This will be a mixture between you Social Care content, the home page and linked pages like the website.
Standard Analytics
These can be view on the tab labelled Dashboard in your left hand menu. You can narrow these to specified time frames and roles where appropriate. They also have a variety of view options like Line Charts or List views.
Total Tests Completed
This displayed the total tests completed in your App by topic and by role. You will see further information on scores achieved by clicking the List View option, and will see further information still if you click the Digital Test Results option in your left hand menu bar.
Total Notifications Sent
This gives you an overview of all notifications sent by date from your App, and further information can be found in the List View, providing the contents and type of notification. The View button will allow you to also view which roles it was sent to.
Total Surveys Published
This will give you and overview of Surveys published in your App by role and date.
Total Adult Accounts
This gives you a breakdown of account creation by date and by role. You can segment these by specified time also, which is particularly useful if you've planned a launch event - you'd hope to see a spike!
Total Under 18 Logins
This shows the total number of times a pupil/student code has been used to access the App for your school.
 As under 18s do not create accounts, this figure could represent 1 child logging in 7 times, or 7 children each logging in once.
Need any help?
Our Service Engagement team are always here to answer any questions you may have and provide you with any technical support you may need.
💻 Check out our other support articles
📞 Call our team on 02890232060
📩 Email us at support@ineqe.com